Sustainability Data
Social
Social (personnel data)
| Subject range | Unit | FY2022 | FY2023 | FY2024 | ||
|---|---|---|---|---|---|---|
| Number of employees | Consolidated | Persons | 6,580 | 6,427 | 6,483 | |
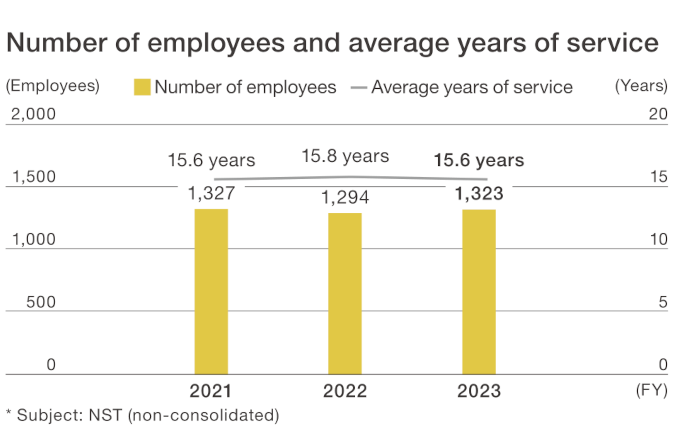
| Total | Non-consolidated | 1,294 | 1,323 | 1,503 | ||
| Men | 747 | 765 | 894 | |||
| Women | 547 | 558 | 609 | |||
| Number of employees in management positions | Total | Non-consolidated | Persons | 564 | 571 | 617 |
| Men | 547 | 553 | 599 | |||
| Women | 17 | 18 | 18 | |||
| Ratio of women in management positions | % | 3.0 | 3.2 | 2.9 | ||
| Number of foreign national employees | Non-consolidated | Persons | 31 | 31 | 36 | |
| Employment of persons with disabilities | Non-consolidated | % | 2.3 | 2.0 | 2.8 | |
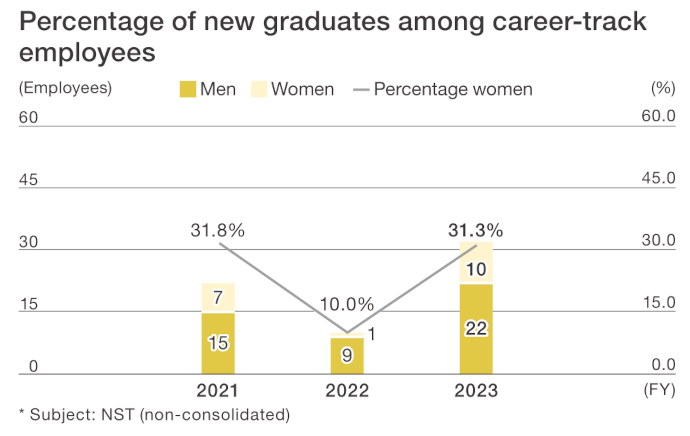
| Number of new graduates hired as career-track employees | Total | Non-consolidated | Persons | 10 | 32 | 50 |
| Men | 9 | 22 | 40 | |||
| Women | 1 | 10 | 10 | |||
| Ratio of women | % | 10.0 | 31.3 | 20.0 | ||
| Foreign nationals | Persons | 1 | 2 | 2 | ||
| Ratio of foreign nationals | % | 10.0 | 6.3 | 4.0 | ||
| Number of mid-career recruits | Total | Non-consolidated | Persons | 22 | 49 | 62 |
| Men | 15 | 36 | 44 | |||
| Women | 7 | 13 | 18 | |||
| Percentage of mid-career recruits among full-time employees | Non-consolidated | % | 68.8 | 59.0 | 55.4 | |
| Average salary (all employees) |
Overall average | Non-consolidated | Thousand yen | 9,918 | 9,961 | 10,412 |
| Average years of service | Total | Non-consolidated | Years | 15.8 | 15.6 | 14.0 |
| Men | 16.4 | 16.0 | 13.9 | |||
| Women | 14.9 | 15.1 | 14.3 | |||
| Average age | Total | Non-consolidated | Years | 44.0 | 44.0 | 43.9 |
| Men | 45.1 | 44.8 | 44.2 | |||
| Women | 42.6 | 43.0 | 43.4 | |||
| Percentage of employees leaving the company for personal reasons (from the previous FY) | Non-consolidated | % | 2.2 | 2.4 | 2.0 | |
Social (working styles, health)
| Subject range | Unit | FY2022 | FY2023 | FY2024 | ||
|---|---|---|---|---|---|---|
| Monthly average overtime working hours | All employees | Non-consolidated | Hours | 28.6 | 26.3 | 26.2 |
| Non-management positions | 26.3 | 23.9 | 23.7 | |||
| Average days of paid annual leave taken by employees | Non-consolidated | Days | 13.2 | 12.7 | 13.5 | |
| Percentage of paid annual leave taken by employees | Non-consolidated | % | 69.0 | 65.2 | 70.5 | |
| Absences for child care (Total days and total persons including special leave) |
Total days | Non-consolidated | Days | 29 | 48 | 40 |
| Total persons | Persons | 43 | 60 | 54 | ||
| Number of employees taking nursing care leave | Non-consolidated | Persons | 1 | 1 | 1 | |
| Number of employees taking pre- and post-childbirth leave | Non-consolidated | Persons | 20 | 18 | 22 | |
| Number of eligible employees taking childcare leave | Total | Non-consolidated | Persons | 32 | 31 | 34 |
| Men | 17 | 10 | 15 | |||
| Women | 15 | 21 | 19 | |||
| Percentage of eligible employees taking childcare leave | Total | Non-consolidated | % | 64.0 | 67.4 | 72.3 |
| Men | 48.6 | 40.0 | 55.6 | |||
| Women | 100 | 100 | 95.0 | |||
| Percentage of employees returning to work after childcare leave | Total | Non-consolidated | % | 97.0 | 96.0 | 94.3 |
| Men | 100 | 100 | 100 | |||
| Women | 92.8 | 93.3 | 90.0 | |||
| Average days of childcare leave taken by male employees | Non-consolidated | Days | 12.6 | 15.5 | 55.3 | |
| Number of violations of the Labor Standards Act | Non-consolidated | Incidents | 0 | 0 | 0 | |
| Percentage of employees undergoing stress checks |
All employees | Non-consolidated | % | 96.0 | 95.7 | 95.9 |
| Percentage of high stress employees | All employees | Non-consolidated | % | 8.8 | 10.0 | 10.5 |
| Percentage of employees undergoing regular medical check |
All employees | Non-consolidated | % | 100 | 100 | 100 |
| Percentage of employees undergoing detailed health examinations |
All employees | Non-consolidated | % | 89.8 | 94.1 | 86.8 |
Social (human resources development)
| Subject range | Unit | FY2022 | FY2023 | FY2024 | ||
|---|---|---|---|---|---|---|
| Skills development training | Total training sessions | Non-consolidated | Sessions | 14 | 13 | 28 |
| Number of training participants | Persons | 367 | 555 | 1,070 | ||
| Number of employees posted overseas | Expatriate staff | Non-consolidated | Persons | 153 | 149 | 149 |
- *Skills development training shows the number of training sessions and number of participants for group training.
Environment
| Subject range | Unit | FY2022 | FY2023 | FY2024 | |||
|---|---|---|---|---|---|---|---|
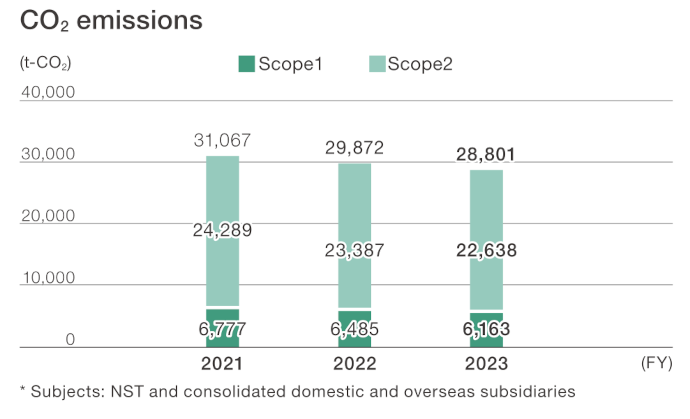
| CO2 emissions |
Scope1+Scope2*1*2 | Consolidated | t-CO2 | 29,896 | 28,829 | 27,091 | |
| Scope1 | 6,510 | 6,192 | 5,658 | ||||
| Scope2 | 23,386 | 22,637 | 21,433 | ||||
| Scope3*3 | Category2. Capital goods | Non-consolidated | 699 | 814 | 6,744*4 | ||
| Category3. Fuel and energy-related activities | 152 | 160 | 175 | ||||
| Category4. Transport, shipping (upstream) | 4,498 | 4,052 | 3,413 | ||||
| Category5. Waste produced from business activities | 60 | 66 | 101 | ||||
| Category6. Business travel | 1,379 | 1,487 | 2,176 | ||||
| Category7. Employee commuting | 380 | 379 | 395 | ||||
| Category8. Lease assets (upstream)*5 | 0 | 0 | 0 | ||||
| Category13. Lease assets (downstream)*5 | 0 | 0 | 0 | ||||
| Category14. Franchises*6 | 0 | 0 | 0 | ||||
| Amount of power used | Consolidated | MWh | 49,062 | 47,455 | 45,898 | ||
| Percentage of power from renewable energy sources*7 | Consolidated | % | 5.0 | 4.4 | 7.1 | ||
| Energy consumption*8 | Consolidated | GJ | 285,209 | 270,915 | 246,897 | ||
| Paper usage | Non-consolidated | 1,000 sheets | 9,648 | 9,756 | 9,588 | ||
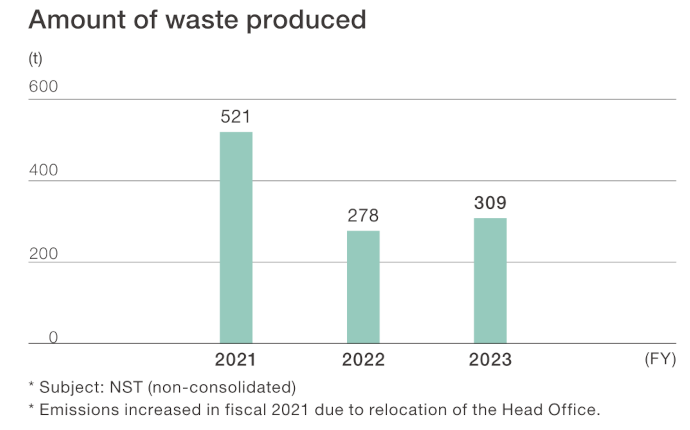
| Amount of waste produced | Non-consolidated | t | 278 | 309 | 511 | ||
- *1Because there were some corrections to the results, Scope1, Scope2, the amount of power used, and energy consumption have been retroactively corrected.
- *2The coefficients referenced when calculating Scope1 and Scope2 are the following.
Fuel emission factors:
(Japan) Greenhouse gas emission quantities based on “List of Calculation Methods and Emission Factors for Greenhouse Gas Emissions in the Calculation, Reporting and Publication System” from the Ministry of the Environment are used.
(Overseas) “2006 IPCC Guidelines for National Greenhouse Gas Inventories” are referenced for the fossil fuel unit calorific values and carbon intensity.
Electrical power emission factors:
(Japan) The adjusted emissions factor in the emission factors for each electrical power company is used.
(Overseas) The CO₂ emissions factor for each country as reported by the International Energy Agency (IEA) is used. - *3Scope3 is disclosed only for limited categories where it was judged that calculation is possible.
- *4 Increased as a result of acquiring fixed assets following the merger with the former NS Architectural Steel Services Corporation.
- *5This is 0 because it is included in Scope1 and Scope2.
- *6This is 0 because there is nothing which would be classified as a franchise business.
- *7Out of the total amount of power used, this calculates the percentage of power used with a CO₂ emission coefficient of 0, such as solar power and CO₂-free power contracts.
- *8A unit calorific value for electrical power of 3.6 GJ/MWh is used. Consumption of power from renewable energy sources is not included. Calculations for fuel are made using the unit calorific values in the Act on the Rational Use of Energy.